
GreenPT Apps
Energy & impact
See the energy, CO2, and inference time behind your own usage, per day, week, or month.
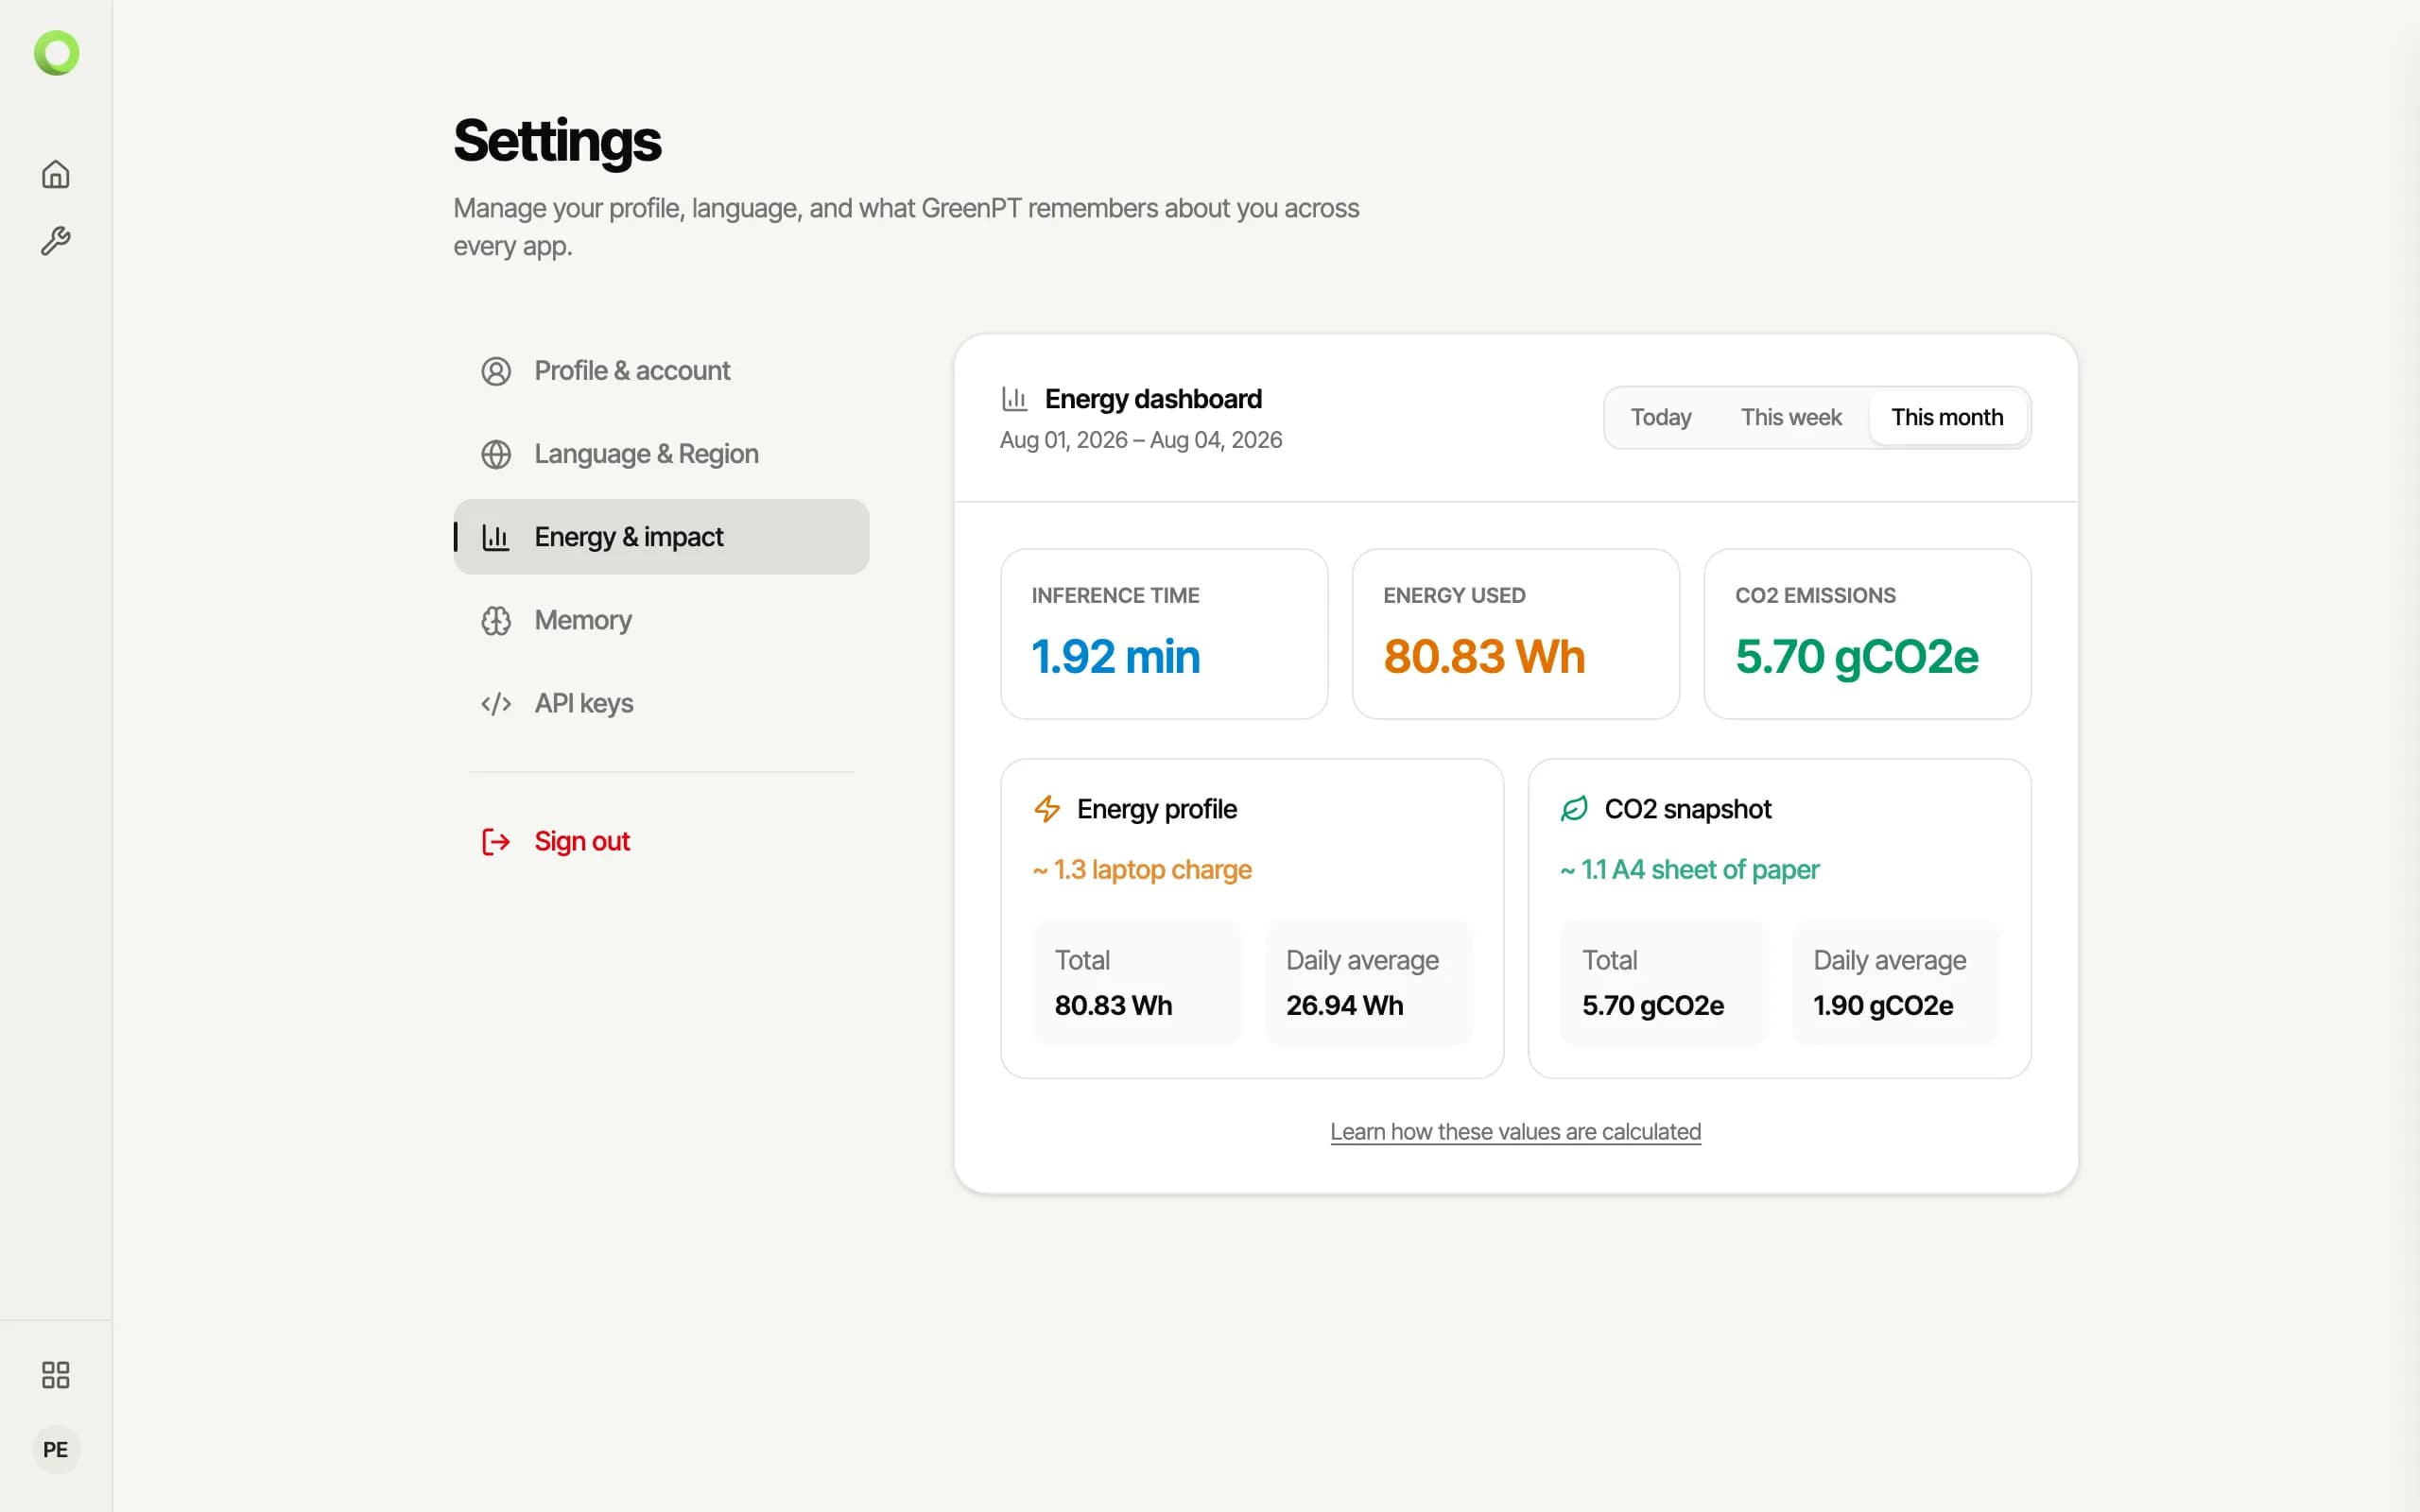
Every answer has a physical footprint. The energy dashboard on your account page turns your own usage into numbers — inference time, energy used, and CO2 emitted — with everyday equivalents to make them concrete.
Open the dashboard
Open your account from the avatar in the sidebar and choose Energy & impact. The dashboard totals your usage for the selected period and translates it: energy as laptop charges, CO2 as sheets of paper.
Switch the period
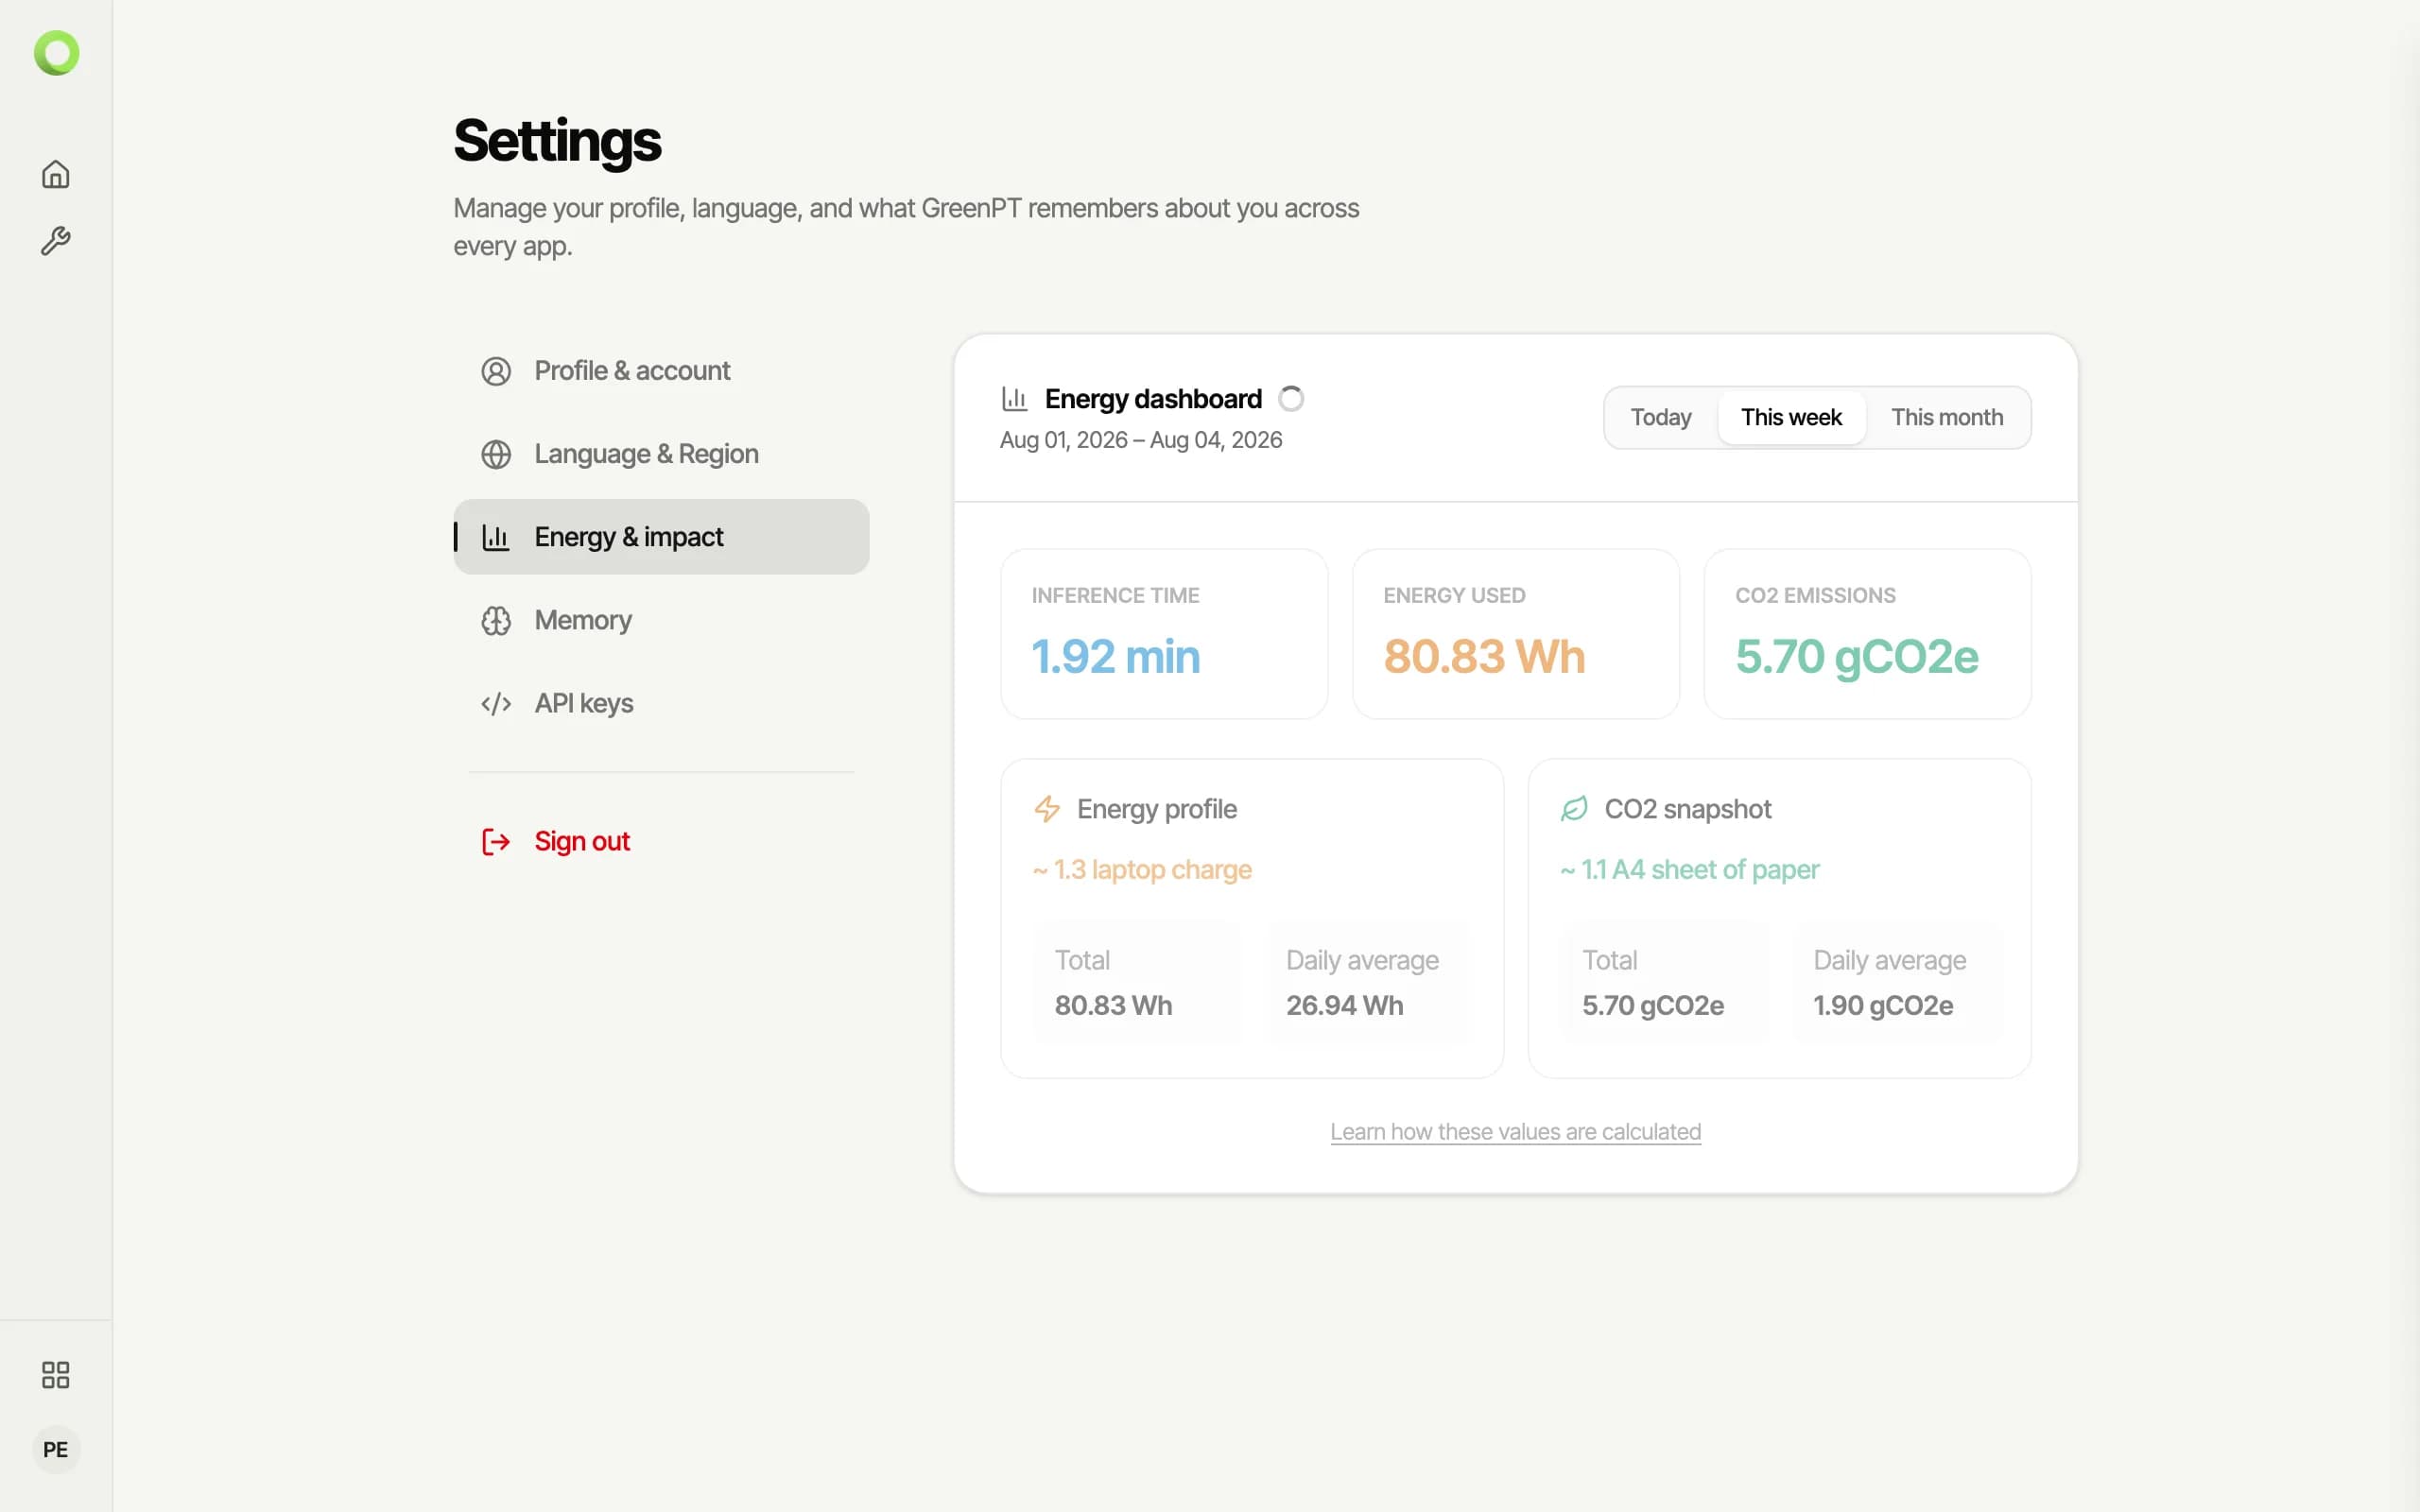
Today, This week, and This month re-total the same view, each with a daily average alongside the total.
How the numbers are computed — and why measuring beats estimating — is covered in Sustainability.